Graphics
2D graphics
The plot function
Basic usage
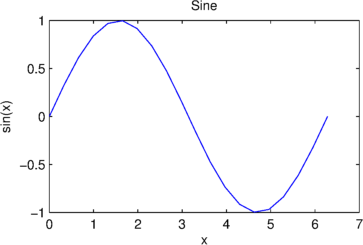
>> x = linspace(0, 2 * pi, 20);
>> y = sin(x);
>> plot(x, y);
>> title('Sine');
>> xlabel('x');
>> ylabel('sin(x)');
>> z = cos(x);
>> plot(x, y, x, z);
>> % or
>> A = [y; z];
>> plot(x, A);
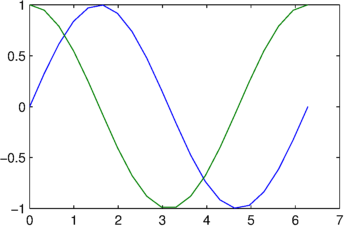
Note that the title and axis labels are cleared.
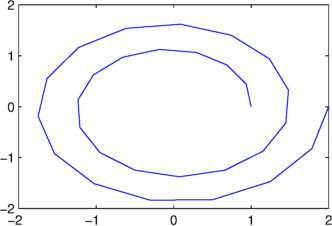
Parametric plots
>> theta = linspace(0, 4 * pi, 30);
>> r = linspace(1, 2, 30);
>> x = r .* cos(theta);
>> y = r .* sin(theta);
>> plot(x, y);
Line Specification (LineSpec)
| Specifier | Line style |
|---|---|
- |
Solid (default) |
-- |
dashed |
: |
dotted |
-. |
dash-dot |
| Specifier | Marker type |
|---|---|
+ |
Plus sign |
o |
Circle |
* |
Asterisk |
. |
Point |
x |
Cross |
s, d, |
Square, Diamond |
p, h |
pentagram, hexagram |
^, v, >, < |
Triangles |
| Specifier | Color |
|---|---|
r |
Red |
g |
Green |
b |
Blue |
c |
Cyan |
m |
Magenta |
y |
Yellow |
k |
Black |
w |
White |
Black is k.
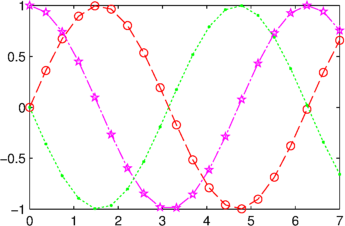
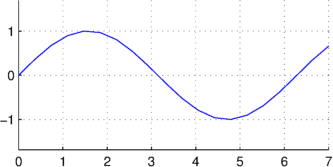
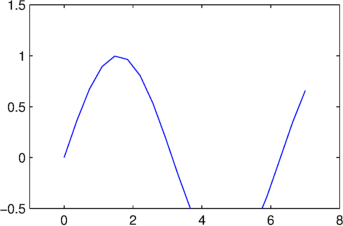
>> x = linspace(0, 7, 20);
>> plot(x, sin(x), '--or', x, cos(x), 'pm-.', x, -sin(x), 'g:.');
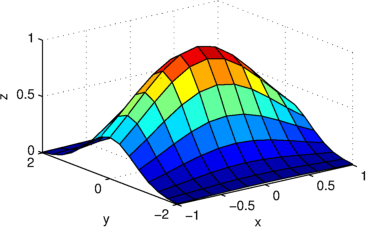
3D graphics
x = linspace(-1, 1, 11);
y = linspace(-2, 2, 15);
[X, Y] = meshgrid(x, y);
Z = exp(-X.^2 - Y.^2);
figure();
surf(X, Y, Z);
xlabel('x'); ylabel('y'); zlabel('z');
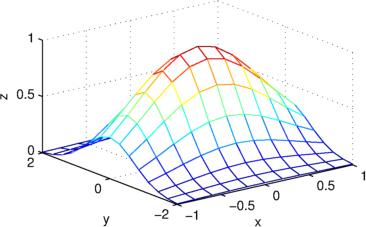
figure();
mesh(X, Y, Z);
xlabel('x'); ylabel('y'); zlabel('z');
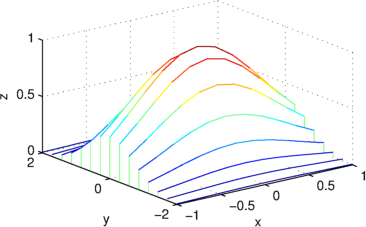
figure();
waterfall(X, Y, Z);
xlabel('x'); ylabel('y'); zlabel('z');
Axes options
box,grid,axis,xlimtitle,xlabel,legend,text
>> plot(x, sin(x));
>> grid on;
>> box off;
>> axis equal;
>> plot(x, sin(x));
>> xlim([-1 8]);
>> ylim([-0.5 1.5]);
Subplots
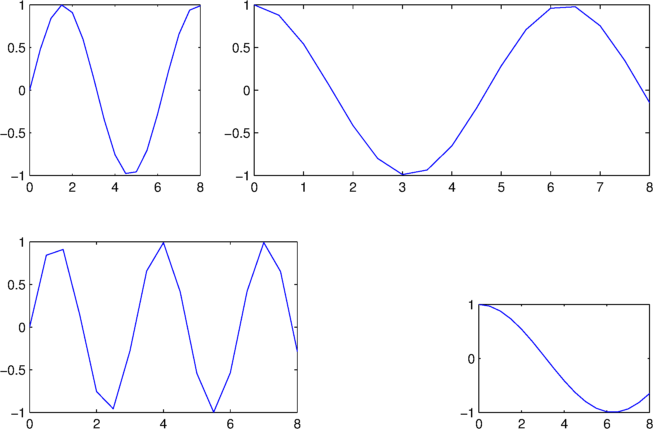
>> x = 0:0.5:8;
>> subplot(2, 3, 1);
>> plot(x, sin(x));
>> subplot(2, 3, [2 3]);
>> plot(x, cos(x));
>> subplot(223);
>> plot(x, sin(2 * x));
>> subplot(339);
>> plot(x, cos(x / 2));
More plots
plotyysemilogx,semilogy,loglogarea,stem,stairsscatterplot3,stem3,scatter3bar,barhpiepolar,rose,compasscontour,contourfquiverimage,imagesc
Handle graphics
>> x = 0:0.1:1;
>> y = x.^2;
>> hf = figure();
>> hl = plot(x, y);
>> ha = gca();
>>
>> a = get(hf)
a =
                 Alphamap: [1x64 double]
             BeingDeleted: 'off'
               BusyAction: 'queue'
            ButtonDownFcn: ''
                 Children: 879
                 Clipping: 'on'
          CloseRequestFcn: 'closereq'
(...)
        WindowButtonUpFcn: ''
        WindowKeyPressFcn: ''
      WindowKeyReleaseFcn: ''
     WindowScrollWheelFcn: ''
              WindowStyle: 'docked'
>> xLim = get(ha, 'XLim')
xLim =
     0     1
>> marker = get(hl, 'Color')
marker =
     0     0     1
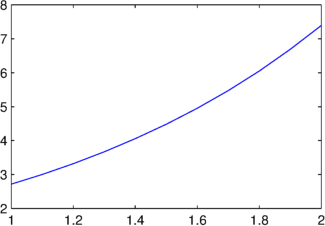
x = 1:0.1:2;
y = exp(x);
hf = figure(); % figure handle
hl = plot(x, y); % lineseries handle
ha = gca(); % axes handle
% First image here
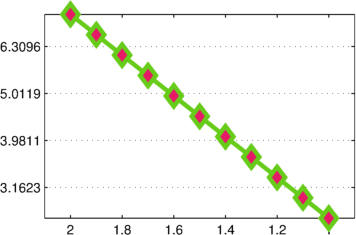
set(ha, 'XLim', get(ha, 'XLim') + [-0.1 0.1]);
set(ha, 'XDir', 'reverse');
set(ha, 'YScale', 'log');
set(ha, 'YGrid', 'on');
set(hl, ...
'Color', [0.4 0.8 0.1], ...
'Marker', 'd', ...
'MarkerSize', 12, ...
'MarkerFace', [0.9 0.1 0.4], ...
'LineWidth', 3);
% Second image here
Movies
% From help for getframe
Z = peaks;
figure('Renderer', 'zbuffer');
surf(Z);
axis tight manual;
set(gca, 'NextPlot', 'replaceChildren');
for k = 1:20
    surf(sin(2 * pi * k / 20) * Z, Z)
    F(k) = getframe;
end
movie(F, 5)
Useful libraries
- export_fig (File Exchange, GitHub)
- matlab2tikz (File Exchange, GitHub)